The Project Charter is a document that confirms the existence of a formal project. It's a statement of the scope, objectives and participants of the project, providing a delineation of roles and responsibilities, identifying the main stakeholders and defining the authority of the project manager.The project charter is usually a short document that refers to more detailed documents such as a new offering request or a request for proposal. Projects as described in the Project Charter can be ranked and authorized by Return on Investment.
In Initiative for Policy Dialogue (IPD), this document is known as the project charter. In customer relationship management (CRM), it is known as the project definition report. Both IPD and CRM require the Prj Charter as part of the project management process.
The purpose of the project charter is to document:
Reasons for undertaking the project
Objectives and constraints of the project
Directions concerning the solution
Identities of the main stakeholders
In-scope and out-of-scope items
Risks identified early on (A risk plan should be part of the overall project management plan)
Target project benefits
High level budget and spending authority
Sunday, 15 November 2015

IT Service Management Forum (itSMF)
The IT Service Management Forum (itSMF) is an independent and not-for-profit institution of IT Service Management (ITSM) professionals worldwide. The role of itSMF is to collect, develop and publish "best practice" in addition to support in education and training of ITSM tools and initiate advisory ideas about ITSM and held conventions. The itSMF is concerned with promoting ITIL (IT Infrastructure Library), Best practice in IT Service Management with a strong emphasis on the ISO/IEC 20000 standard. The itSMF publishes books covering various aspects of Service Management through a process of endorsing them as part of the itSMF Library.
Organizations with ties to ITIL:
1- The Office of Government Commerce (OGC) is part of the Efficiency and Reform Group of the Cabinet Office, a department of the Government of the United Kingdom.
2- The Stationery Office (TSO) a privatised publishing arm of Her Majesty's Stationery Office, is the current ITIL publisher.
3- Axelos is the official accreditor for qualifications based on their Best Practice guidance portfolio.
In addition to ITIL, itSMF also encompasses the following topics:
a - ISACA is an international professional association, well known for COBIT (Control Objectives for Information and Related Technology) as framework for IT Management and IT Governance.
b- ISO/IEC 20000 - The international standard for organizations, which will show their performance in ITSM.
c- ISO/IEC 15504, also known as SPICE (Software Process Improvement and Capability Determination) The international standard for capability in information technology process measured with a standard assessment method.
References:
http://www.itsmfi.org/
https://en.wikipedia.org/wiki/IT_Service_Management_Forum
Organizations with ties to ITIL:
1- The Office of Government Commerce (OGC) is part of the Efficiency and Reform Group of the Cabinet Office, a department of the Government of the United Kingdom.
2- The Stationery Office (TSO) a privatised publishing arm of Her Majesty's Stationery Office, is the current ITIL publisher.
3- Axelos is the official accreditor for qualifications based on their Best Practice guidance portfolio.
In addition to ITIL, itSMF also encompasses the following topics:
a - ISACA is an international professional association, well known for COBIT (Control Objectives for Information and Related Technology) as framework for IT Management and IT Governance.
b- ISO/IEC 20000 - The international standard for organizations, which will show their performance in ITSM.
c- ISO/IEC 15504, also known as SPICE (Software Process Improvement and Capability Determination) The international standard for capability in information technology process measured with a standard assessment method.
References:
http://www.itsmfi.org/
https://en.wikipedia.org/wiki/IT_Service_Management_Forum
5S
The 5S is a work design methodoly inherent to the production industry although it has increasingly been applied in the service sector as well which stands for a instrument of workplace organisation to keep it clean and suitable for work practices. Since cleanliness and order are the basic requirements of efficient work processes, the 5S is often used as a tool for continuous improvement. They can be translated from the Japanese as
"sort", "straighten", "shine", "standardise" and "sustain" and they are:
Seiri
https://en.wikipedia.org/wiki/5S_%28methodology%29
Seiri
整理 (Sort)
- keeping only necessary items
- Make work easier by eliminating obstacles.
- Reduce chance of being disturbed with unnecessary items
- Prevent accumulation of unnecessary items
- Segregate unwanted material from the workplace
Seiton
整頓 (Systematic Arrangement)
- Can also be translated as "put in order", "straighten", or "streamline"
- Arrange all necessary items so they can be easily selected for use
- Prevent loss and waste of time
- Ensure first-come-first-served basis
Seiso
清掃 (Shine)
- Can also be translated as "sweep", "sanitize", or "scrub"
- Clean your workplace regularly and thoroughly
- Prevent machinery and equipment deterioration
Seiketsu
清潔 (Standardize)
- Standardise the best practices in the work area.
- Maintain high standards of housekeeping and workplace organisation at all times.
- Everything in its right place.
Shitsuke
躾 (Sustain)
- Also translates as "do without being told"
- Perform regular audits
- Enforce constant training and discipline
https://en.wikipedia.org/wiki/5S_%28methodology%29
Process Maps/ Flowcharts
Process Maps (also called process flowchart, process flow diagram, macro flowchart, top-down flowchart, detailed flowchart, deployment flowchart or several-leveled flowchart), is a visual depiction of how processes relate to each other, including the relationship between inputs and outputs and where key decision points lie. Elements that may be included are: sequence of actions, materials or services entering or leaving the process (inputs and outputs), decisions that must be made, people who become involved, time involved at each step and/or process measurements. The process described can be a manufacturing, administrative or service or a project plan.
When to Use a Flowchart:
1 To develop understanding of how a process is done.
2 To study a process for improvement.
3 To communicate to others how a process is done.
4 When better communication is needed between people involved with the same process.
5 To document a process.
6 When planning a project.
Examples:
 Direction of flow from one step or decision to another.
 Decision based on a question. The question is written in the diamond.
More than one arrow goes out of the diamond, each one showing
the direction the process takes for a given answer to the question.
(Often the answers are “ yes” and “ no.”)
 Delay or wait
 Link to another page or another flowchart. The same symbol on the other page indicates that the flow continues there.
 Input or output
 Document
 Alternate symbols for start and end points
References:
ASQ. What is a Process Flowchart? <http://asq.org/learn-about-quality/process-analysis-tools/overview/flowchart.html> Retrieved 15/11/2015.
BARRY, Carly.My Favourtite Quality Tool: Process Mapping <http://blog.minitab.com/blog/real-world-quality-improvement/my-favorite-quality-tool-process-mapping> 2013. Retrieved 15/11/2015.
When to Use a Flowchart:
1 To develop understanding of how a process is done.
2 To study a process for improvement.
3 To communicate to others how a process is done.
4 When better communication is needed between people involved with the same process.
5 To document a process.
6 When planning a project.
Examples:
High–Level Flowchart for an Order-Filling Process

Detailed Flowchart

Commonly Used Symbols in Detailed Flowcharts
One step in the process; the step is written inside the box. Usually, only one arrow goes out of the box.
Direction of flow from one step or decision to another.
Decision based on a question. The question is written in the diamond.
More than one arrow goes out of the diamond, each one showing
the direction the process takes for a given answer to the question.
(Often the answers are “ yes” and “ no.”)Delay or wait Link to another page or another flowchart. The same symbol on the other page indicates that the flow continues there.
Input or output
DocumentAlternate symbols for start and end pointsReferences:
ASQ. What is a Process Flowchart? <http://asq.org/learn-about-quality/process-analysis-tools/overview/flowchart.html> Retrieved 15/11/2015.
BARRY, Carly.My Favourtite Quality Tool: Process Mapping <http://blog.minitab.com/blog/real-world-quality-improvement/my-favorite-quality-tool-process-mapping> 2013. Retrieved 15/11/2015.
7 tools of quality
The seven quality tools were first proposed by Kaoru Ishikawa due to their indisplensable nature and all-around use not only among quality management professionals but for just about anyone. They are:
Its simplicity allows for great accuracy when it's necessary to evaluate the efficiency of a process. The standard procedure for using a check sheet is drawing a matrix with columns and rows and record the behaviour of data by making check marks in the fields (the defining characteristic of a check sheet), which should be clearly labelled to reflect the assessed process on the form. Test the check sheet for a short trial period to be sure it collects the appropriate data and keeping track of each time the targeted event or problem occurs, recording data on the check sheet. The checks on the check sheet are usually made to indicate defects or flaws from an observed production system.
Function
3- Control Charts: Also known as Shewhart's charts or process-bhaviour charts, are graphs used to spot changes in processes over time. It's a tool typical of statistical process control (hence why it's named after Shewhart, since the man has a lot to do with statistical control to achieve quality). Control charts are used to measure whether a process is under control. By being in control it's meant that the process is stable, with predictable variations that are inherent to the process, with no ensuing degradation. If analysis of the process reveals that it's not in control, the chart helps track the source of the variation.A process that meets agreed upon standards of stability but operating outside of specified limits (e.g., scrap rates may be in statistical control but above desired limits) a deliberate effort to understand the causes of the faulty performance means an increase in performance improvement. The goal of the control chart is the evaluation of processes through chronological quality stability.
4 - Histogram: for frequency of numerical values. It consists of a display where the data is grouped into ranges and then plotted as bars. To construct a histogram, the first step is to "bin" the range of values—that is, divide the entire range of values into a series of intervals—and then count how many values fall into each interval. The bins are usually specified as consecutive, non-overlapping intervals of a variable. The bins (intervals) must be adjacent, and are usually equal size.
Histograms are often confused with bar charts. A histogram is used for continuous data, where the bins represent ranges of data, and the areas of the rectangles are meaningful (rectangles touching each other indicates data continuity, thus the gaps between bars matter), while a bar chart is a plot of categorical variables and the discontinuity should be indicated by having gaps between the rectangles, from which only the length is meaningful. Often this is neglected, which may lead to a bar chart being confused for a histogram.
5- Pareto Chart: Pareto is a widely known concept used to explain which causes are responsible for the biggest consequences. The classical definition is that 20% of the factors are responsible for 80% of the effects. Pareto diagram is a column chart where single values are arranged according to their significance. The greatest values are on the far left while to the right are the smaller values, the lengths of which represent frequency or cost (time or money). The Pareto chart is used to identify the root-causes that most influence the occurrence of problems.
6- Scatter diagram (also called scatter plot)- Graphs pairs of numerical data, one variable on each axis, to look for a relationship. It uses carthesian coordinates to represent two variables for a set data. Two variables is typically used as use of thsi tool is supposed to look for a relationhsip between the compared values. Colour-coding the points allows for more variables.
A scatter plot can be used either when one continuous variable that is under the control of the experimenter and the other depends on it or when both continuous variables are independent. If a parameter exists that is systematically incremented and/or decremented by the other, it is called the control parameter or independent variable and is customarily plotted along the horizontal axis. The measured or dependent variable is customarily plotted along the vertical axis. If no dependent variable exists, either type of variable can be plotted on either axis and a scatter plot will illustrate only the degree of correlation (not causation) between two variables.
In computational statistics, stratified sampling is a method of variance reduction when Monte Carlo methods are used to estimate population statistics from a known population.
References:
https://en.wikipedia.org/wiki/Ishikawa_diagram
https://en.wikipedia.org/wiki/Check_sheet
https://en.wikipedia.org/wiki/Control_chart
https://en.wikipedia.org/wiki/Histogram
https://en.wikipedia.org/wiki/Pareto_chart
https://en.wikipedia.org/wiki/Scatter_plot
https://en.wikipedia.org/wiki/Stratified_sampling
http://www.itl.nist.gov/div898/handbook/pmc/pmc.htm
http://www.astroml.org/user_guide/density_estimation.html
http://www.psychwiki.com/wiki/What_is_a_scatterplot%3F
- Cause and effect diagram (also called Ishikawa or fishbone chart):
Identifies possible causes for an effect or problem and sorts
ideas into useful categories. It consists of first thinking of the root-cause or the effect, then ideas are grouped in order to explain this effect or what is causing this problem into major categories to identify these sources of variation, whic typically include:People: Anyone involved with the processMethods: How the process is performed and the specific requirements for doing it, such as policies, procedures, rules, regulations and lawsMachines: Any equipment, computers, tools, etc. required to accomplish the jobMaterials: Raw materials, parts, pens, paper, etc. used to produce the final productMeasurements: Data generated from the process that are used to evaluate its qualityEnvironment: The conditions, such as location, time, temperature, and culture in which the process operatesThe fishbone has an ancillary benefit as well. Because people by nature often like to get right to determining what to do about a problem, this can help bring out a more thorough exploration of the issues behind the problem – which will lead to a more robust solution.
Its simplicity allows for great accuracy when it's necessary to evaluate the efficiency of a process. The standard procedure for using a check sheet is drawing a matrix with columns and rows and record the behaviour of data by making check marks in the fields (the defining characteristic of a check sheet), which should be clearly labelled to reflect the assessed process on the form. Test the check sheet for a short trial period to be sure it collects the appropriate data and keeping track of each time the targeted event or problem occurs, recording data on the check sheet. The checks on the check sheet are usually made to indicate defects or flaws from an observed production system.
Check sheets typically employ a heading that answers the Five Ws:
Who filled out the check sheet
What was collected (what each check represents, an identifying batch or lot number)
Where the collection took place (facility, room, apparatus)
When the collection took place (hour, shift, day of the week)
Why the data were collected
Function
Kaoru Ishikawa identified five uses for check sheets in quality control:
To check the shape of the probability distribution of a process
To quantify defects by type
To quantify defects by location
To quantify defects by cause (machine, worker)
To keep track of the completion of steps in a multistep procedure (in other words, as a checklist)
The Four Process States
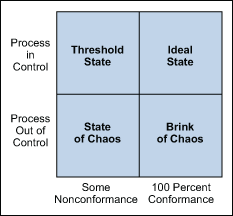
Processes fall into one of four states: 1) the ideal, 2) the threshold, 3) the brink of chaos and 4) the state of chaos (Figure 1).
When a process operates in the ideal state, that process is in statistical control and produces 100 percent conformance, being predictable and meeting customer expectations. This state is only confirmed after the process has been under observation over a set period of time.
A process that is in the threshold state is still in statistical control even though it produces the occasional nonconformance. This type of process will produce a constant level of nonconformances and exhibits low capability. Although predictable, this process does not consistently meet customer needs.
The brink of chaos state reflects a process that is not in statistical control, but also is not producing defects. The outputs of the process still meet customer requirements, but the unpredictability means the process can produce nonconformances at any moment.
The fourth process state is the state of chaos. Here, the process is not in statistical control and produces unpredictable levels of nonconformance.
Figure 1: Four Process States
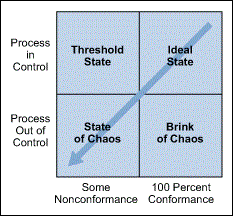
Every process falls into one of these states at any given time, but they all tend to gravitate toward the state of chaos. Companies typically begin some type of improvement effort when a process reaches the state of chaos (although arguably they would be better served to initiate improvement plans at the brink of chaos or threshold state). Control charts are used to prevent this natural degradation and steer performance back to the ideal state.
Figure 2: Natural Process Degradation
Elements of a Control Chart
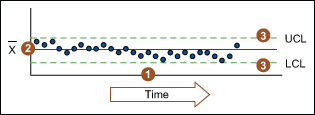
There are three main elements of a control chart as shown in the figure below:
- A control chart begins with a time series graph.
- A central line (X or process location) is added as a visual reference for detecting shifts or trends.
- Upper and lower control limits (UCL and LCL) are calculated from available data and placed halfway from the central line. This is also referred to as process dispersion.
Figure 3: Elements of a Control Chart
Control limits (CLs) ensure time is not wasted looking for unnecessary trouble – the goal of any process improvement practitioner should be to only take action when warranted. Control limits are calculated by:
- Estimating the standard deviation of the sample data
- Multiplying that number by three
- Adding (3 x s.d. to the average) for the UCL and subtracting (3 x d.v. from the average) for the LCL
4 - Histogram: for frequency of numerical values. It consists of a display where the data is grouped into ranges and then plotted as bars. To construct a histogram, the first step is to "bin" the range of values—that is, divide the entire range of values into a series of intervals—and then count how many values fall into each interval. The bins are usually specified as consecutive, non-overlapping intervals of a variable. The bins (intervals) must be adjacent, and are usually equal size.
Histograms are often confused with bar charts. A histogram is used for continuous data, where the bins represent ranges of data, and the areas of the rectangles are meaningful (rectangles touching each other indicates data continuity, thus the gaps between bars matter), while a bar chart is a plot of categorical variables and the discontinuity should be indicated by having gaps between the rectangles, from which only the length is meaningful. Often this is neglected, which may lead to a bar chart being confused for a histogram.
5- Pareto Chart: Pareto is a widely known concept used to explain which causes are responsible for the biggest consequences. The classical definition is that 20% of the factors are responsible for 80% of the effects. Pareto diagram is a column chart where single values are arranged according to their significance. The greatest values are on the far left while to the right are the smaller values, the lengths of which represent frequency or cost (time or money). The Pareto chart is used to identify the root-causes that most influence the occurrence of problems.
6- Scatter diagram (also called scatter plot)- Graphs pairs of numerical data, one variable on each axis, to look for a relationship. It uses carthesian coordinates to represent two variables for a set data. Two variables is typically used as use of thsi tool is supposed to look for a relationhsip between the compared values. Colour-coding the points allows for more variables.
A scatter plot can be used either when one continuous variable that is under the control of the experimenter and the other depends on it or when both continuous variables are independent. If a parameter exists that is systematically incremented and/or decremented by the other, it is called the control parameter or independent variable and is customarily plotted along the horizontal axis. The measured or dependent variable is customarily plotted along the vertical axis. If no dependent variable exists, either type of variable can be plotted on either axis and a scatter plot will illustrate only the degree of correlation (not causation) between two variables.
A scatter plot can suggest various kinds of correlations between variables with a certain confidence interval. For example, weight and height, weight would be on y axis and height would be on the x axis. Correlations may be positive (rising), negative (falling), or null (uncorrelated). If the pattern of dots slopes from lower left to upper right, it indicates a positive correlation between the variables being studied. If the pattern of dots slopes from upper left to lower right, it indicates a negative correlation. A line of best fit (alternatively called 'trendline') can be drawn in order to study the relationship between the variables. An equation for the correlation between the variables can be determined by established best-fit procedures. For a linear correlation, the best-fit procedure is known as linear regression and is guaranteed to generate a correct solution in a finite time.
One of the most powerful aspects of a scatter plot, however, is its ability to show nonlinear relationships between variables. The ability to do this can be enhanced by adding a smooth line such as loess. Furthermore, if the data are represented by a mixture model of simple relationships, these relationships will be visually evident as superimposed patterns.
When to Use a Scatter Diagram:
-When you have paired numerical data.
-When your dependent variable may have multiple values for each value of your independent variable.
-When trying to determine whether the two variables are related, such as…
-When trying to identify potential root causes of problems.
-to determine objectively whether a particular cause and effect are related on a fishbone diagram.
-When determining whether two effects that appear to be related both occur with the same cause.
-When testing for autocorrelation before constructing a control chart.
7 -Stratification - (also called flowchart or run chart) A technique that separates data gathered from a variety of sources so that patterns can be seen (some lists replace “stratification” with “flowchart” or “run chart”). A technique used in combination with other data analysis tools, it uses data from a variety of sources or categories that have been lumped together, separating.
7 -Stratification - (also called flowchart or run chart) A technique that separates data gathered from a variety of sources so that patterns can be seen (some lists replace “stratification” with “flowchart” or “run chart”). A technique used in combination with other data analysis tools, it uses data from a variety of sources or categories that have been lumped together, separating.
When to Use Stratification:
1-Before collecting data.
2-When data come from several sources or conditions, such as shifts, days of the week, suppliers or population groups.
3- When data analysis may require separating different sources or conditions.
Stratification Procedure
Before collecting data, consider which information about the sources of the data might have an effect on the results. Set up the data collection so that you collect that information as well.
When plotting or graphing the collected data on a scatter diagram, control chart, histogram or other analysis tool, use different marks or colors to distinguish data from various sources. Data that are distinguished in this way are said to be “stratified.”
Analyse the subsets of stratified data separately. For example, on a scatter diagram where data are stratified into data from source 1 and data from source 2, draw quadrants, count points and determine the critical value only for the data from source 1, then only for the data from source 2.
References:
https://en.wikipedia.org/wiki/Ishikawa_diagram
https://en.wikipedia.org/wiki/Check_sheet
https://en.wikipedia.org/wiki/Control_chart
https://en.wikipedia.org/wiki/Histogram
https://en.wikipedia.org/wiki/Pareto_chart
https://en.wikipedia.org/wiki/Scatter_plot
https://en.wikipedia.org/wiki/Stratified_sampling
http://www.itl.nist.gov/div898/handbook/pmc/pmc.htm
http://www.astroml.org/user_guide/density_estimation.html
http://www.psychwiki.com/wiki/What_is_a_scatterplot%3F
Tuesday, 10 November 2015
Hoshin Kanri
Hoshin Kanri
Hoshin Kanri (also called Policy Deployment, Management by Policy or Management by planning) is a method for bringing about progress at the strategical, tactial and operational level within a company by ensuring that every employee's activities are coordinated in synchrony according to the company's strategy. If you ever feel that the company's very strategy and goals are omitting your needs or are not meaningful to you, then chances are your company hasn't implemented Hoshin Kanri.
It is not as well-known as the other lean tools. It works best in a well-developed lean culture, where continuous improvement is firmly ingrained at all levels of a company, and any organization can benefit from its core principles:
- Visionary strategic planning (focusing on the things that really matter)
- Catchball (building workable plans through consensus)
- Measuring progress (carefully selecting KPIs that will drive the desired behavior)
- Closing the loop (using regular follow-up to keep progress on track)
Hoshin Kanri relies on a "flattened management framework" where the fewer levels of management the faster the decision making progress resulting from the information gatehred from the closed loop system.
In order to understand Hoshin Kanri, it's important to walk through the following steps:
Step One – Create a Strategic Plan
Hoshin Kanri starts with a strategic plan (e.g. an annual plan) developed by the top management to further the long range goals of the company. This plan should be carefully crafted to address a small number of critical issues. Key items to consider when developing the strategic plan are:
Focus on five goals (or fewer). Drawing up a list of goals may give a false sense of progress, with the more the better. In reality, a goal only expresses intent.
Taking action is what matters. Every company has finite resources and energy coupled with a limited attention span. Focusing on a small number of goals makes success far more likely than dissipating energy across dozens of goals. It's similar to the law of diminishing returns in which writing up more goals won't result in more progress as energy that could be channelled to one endeavour is scattered hastily trying to accomplish more than one can handle.
Effectiveness First: There is a well-known distinction between efficiency and effectiveness: efficiency is doing things right while effectiveness is doing the right things. Strategic goals need to be effective – doing the right things to take the company to the next level.
Evolution vs. Revolution Goals can be evolutionary (incremental goals usually achieved through continuous improvement) or revolutionary (breakthrough changes with dramatic scope). Both entail progress in the form of improvement. It's similar to Hamel's concept of innovation, which can incremental (by changing the way you peform a process) or radical (changing the process altogether).
Top Down Consensus. Top management is responsible for developing the strategic plan but consulting with middle management provides additional perspective and feedback that helps craft stronger, more informed strategies while fostering an atmosphere of shared responsibility and significantly acquire more buy-in from middle management. Careful KPIs. Key Performance Indicators (KPIs) provide the means for tracking progress towards goals. It's important to spare some care when choosing which KPIs will help produce the desirable behaviour without creating perverse incentives, like single-minded pursuit of efficiency at the cost of pushing minor drawbacks to be fixed later.
Own the Goal. a facilitator with the skills and authority to successfully see the goal through to conclusion by removing roadblocks that may be hindering progress and making sure the path to progress is always the one followed.
Step Two – Develop Tactics
Mid-level managers are often tasked with tactics that will best achieve the goals as laid out by top management. One of the most important aspects of this process is "catchball"…a back and forth interaction with top management to ensure understanding of the goals and strategy and tactics are well aligned. Tactics may change so flexibility and adaptability are mighty needs of this process. As a result it is helpful to have regular progress reviews (e.g. monthly), at which time results are evaluated and tactics are reviewed.
Step Three – Take Action
At the plant floor level, supervisors and team leaders work out the operational details to implement the tactics as laid out by mid-level managers. The catchball pattern makes another appearance here as the management levels engage in ongoing exchange with the to ensure alignemnt of the company's strategy. This is where goals and plans are converted into results. This is gemba (the place where real action occurs). Therefore, managers should stay closely connected to activity at this level, even if this means reenacting the notorious business practice of the hovering boss.
Step Four – Review and Adjust
So far the steps have focused on cascading strategic goals down through levels of the company; from top management all the way down to the plant floor. Just as important if the flow of information, which should follow a reverse pattern thus creating a closed loop.
Progress should be tracked continuously and reviewed formally on a regular basis (e.g. monthly). These progress checkpoints provide an opportunity for adjustment of tactics and their associated operational details.
Refereneces:
Hoshin Kanri. Lean Production Retrieved <http://www.leanproduction.com/hoshin-kanri.html>
Hoshin Management. Retrieved <https://de.wikipedia.org/wiki/Hoshin-Management>
Hoshin Kanri (also called Policy Deployment, Management by Policy or Management by planning) is a method for bringing about progress at the strategical, tactial and operational level within a company by ensuring that every employee's activities are coordinated in synchrony according to the company's strategy. If you ever feel that the company's very strategy and goals are omitting your needs or are not meaningful to you, then chances are your company hasn't implemented Hoshin Kanri.
It is not as well-known as the other lean tools. It works best in a well-developed lean culture, where continuous improvement is firmly ingrained at all levels of a company, and any organization can benefit from its core principles:
- Visionary strategic planning (focusing on the things that really matter)
- Catchball (building workable plans through consensus)
- Measuring progress (carefully selecting KPIs that will drive the desired behavior)
- Closing the loop (using regular follow-up to keep progress on track)
Hoshin Kanri relies on a "flattened management framework" where the fewer levels of management the faster the decision making progress resulting from the information gatehred from the closed loop system.
In order to understand Hoshin Kanri, it's important to walk through the following steps:
Step One – Create a Strategic Plan
Hoshin Kanri starts with a strategic plan (e.g. an annual plan) developed by the top management to further the long range goals of the company. This plan should be carefully crafted to address a small number of critical issues. Key items to consider when developing the strategic plan are:
Focus on five goals (or fewer). Drawing up a list of goals may give a false sense of progress, with the more the better. In reality, a goal only expresses intent.
Taking action is what matters. Every company has finite resources and energy coupled with a limited attention span. Focusing on a small number of goals makes success far more likely than dissipating energy across dozens of goals. It's similar to the law of diminishing returns in which writing up more goals won't result in more progress as energy that could be channelled to one endeavour is scattered hastily trying to accomplish more than one can handle.
Effectiveness First: There is a well-known distinction between efficiency and effectiveness: efficiency is doing things right while effectiveness is doing the right things. Strategic goals need to be effective – doing the right things to take the company to the next level.
Evolution vs. Revolution Goals can be evolutionary (incremental goals usually achieved through continuous improvement) or revolutionary (breakthrough changes with dramatic scope). Both entail progress in the form of improvement. It's similar to Hamel's concept of innovation, which can incremental (by changing the way you peform a process) or radical (changing the process altogether).
Top Down Consensus. Top management is responsible for developing the strategic plan but consulting with middle management provides additional perspective and feedback that helps craft stronger, more informed strategies while fostering an atmosphere of shared responsibility and significantly acquire more buy-in from middle management. Careful KPIs. Key Performance Indicators (KPIs) provide the means for tracking progress towards goals. It's important to spare some care when choosing which KPIs will help produce the desirable behaviour without creating perverse incentives, like single-minded pursuit of efficiency at the cost of pushing minor drawbacks to be fixed later.
Own the Goal. a facilitator with the skills and authority to successfully see the goal through to conclusion by removing roadblocks that may be hindering progress and making sure the path to progress is always the one followed.
Step Two – Develop Tactics
Mid-level managers are often tasked with tactics that will best achieve the goals as laid out by top management. One of the most important aspects of this process is "catchball"…a back and forth interaction with top management to ensure understanding of the goals and strategy and tactics are well aligned. Tactics may change so flexibility and adaptability are mighty needs of this process. As a result it is helpful to have regular progress reviews (e.g. monthly), at which time results are evaluated and tactics are reviewed.
Step Three – Take Action
At the plant floor level, supervisors and team leaders work out the operational details to implement the tactics as laid out by mid-level managers. The catchball pattern makes another appearance here as the management levels engage in ongoing exchange with the to ensure alignemnt of the company's strategy. This is where goals and plans are converted into results. This is gemba (the place where real action occurs). Therefore, managers should stay closely connected to activity at this level, even if this means reenacting the notorious business practice of the hovering boss.
Step Four – Review and Adjust
So far the steps have focused on cascading strategic goals down through levels of the company; from top management all the way down to the plant floor. Just as important if the flow of information, which should follow a reverse pattern thus creating a closed loop.
Progress should be tracked continuously and reviewed formally on a regular basis (e.g. monthly). These progress checkpoints provide an opportunity for adjustment of tactics and their associated operational details.
 | |
| Mmgt by Deployments basic chart |
Refereneces:
Hoshin Kanri. Lean Production Retrieved <http://www.leanproduction.com/hoshin-kanri.html>
Hoshin Management. Retrieved <https://de.wikipedia.org/wiki/Hoshin-Management>
Monday, 9 November 2015
The 4 eras of Quality Management
The 4 Eras Of Quality Management Management
In today's business environment, quality is the utmost agent of survival assurance in this competitive globalised world. Everyone knows the burden of having to deal with poor quality be it in the form of a subpar performance or substandard products. In an organisational environment, poor quality is exarcebated when the staff are either not used to performing according to established quality standards or underperform on purpose. Definitions of quality abound in academic and corporative circles. The most used ones are:
Conformance to specifications: Measures how well the product or service meets the target and tolerance determined by its designer (Crosby,1979)
Fitness for use: Focuses on how well the product performs its intended function or use (Juran, 1951).
Value for price paid: Is a definition of quality that consumers often use for products or service usefulness (Garvin,1984)
A psychological criterion: Is a subject definition that focuses on the judgmental evaluate on of what constitutes product or service quality (Garvin, 1984).
It becomes clear how quality is linked to how a product or service is judged. To accurate measure quality, judging the features of a product is not enough; the concept of quality has expanded to encompass the work personel, processes, organisational culture and environment behind the design of said prodcu or service. It goes without saying that quality in the manufacturing sector differs from quality in service sector in one basic aspect: a product is something altogether tangible and thus more easy to speak for itself when a transaction with a customer looms, while the service sector is intnagible and therefore business conduction relies more heavily on commercial aspects of the company (e.g.: marketing).
There has been a shift from isolated quality to Total Quality management as the tenets of the new pradigm are entirely different from past management practices. Approaches to quality have followed a trail of refinements over previously held concepts about quality over the last century, with each new approach bringing new discoveries and tools to better translate the concept of quality into the business strategic goals.
The 4 Eras of quality management
The quality management eras provides a basis for an ongoing evolution in quality-oriented management with one school of thought succeding another following the conclusions resulting from practices utilised in the previous era:
1 Quality development through inspection
According to Garvin (1988), the development of quality management started with inspection. The outcome of Industrial Revolution developed specialists who 'inspected' quality in products. Scientific management occurred because of environmental influences providing the basis for the development of quality management inspection.
Executive Summary: focus on Uniformity;base don Industrial revolution; Quality Control in Manufacturing
In today's business environment, quality is the utmost agent of survival assurance in this competitive globalised world. Everyone knows the burden of having to deal with poor quality be it in the form of a subpar performance or substandard products. In an organisational environment, poor quality is exarcebated when the staff are either not used to performing according to established quality standards or underperform on purpose. Definitions of quality abound in academic and corporative circles. The most used ones are:
Conformance to specifications: Measures how well the product or service meets the target and tolerance determined by its designer (Crosby,1979)
Fitness for use: Focuses on how well the product performs its intended function or use (Juran, 1951).
Value for price paid: Is a definition of quality that consumers often use for products or service usefulness (Garvin,1984)
A psychological criterion: Is a subject definition that focuses on the judgmental evaluate on of what constitutes product or service quality (Garvin, 1984).
It becomes clear how quality is linked to how a product or service is judged. To accurate measure quality, judging the features of a product is not enough; the concept of quality has expanded to encompass the work personel, processes, organisational culture and environment behind the design of said prodcu or service. It goes without saying that quality in the manufacturing sector differs from quality in service sector in one basic aspect: a product is something altogether tangible and thus more easy to speak for itself when a transaction with a customer looms, while the service sector is intnagible and therefore business conduction relies more heavily on commercial aspects of the company (e.g.: marketing).
There has been a shift from isolated quality to Total Quality management as the tenets of the new pradigm are entirely different from past management practices. Approaches to quality have followed a trail of refinements over previously held concepts about quality over the last century, with each new approach bringing new discoveries and tools to better translate the concept of quality into the business strategic goals.
The 4 Eras of quality management
The quality management eras provides a basis for an ongoing evolution in quality-oriented management with one school of thought succeding another following the conclusions resulting from practices utilised in the previous era:
1 Quality development through inspection
According to Garvin (1988), the development of quality management started with inspection. The outcome of Industrial Revolution developed specialists who 'inspected' quality in products. Scientific management occurred because of environmental influences providing the basis for the development of quality management inspection.
Executive Summary: focus on Uniformity;base don Industrial revolution; Quality Control in Manufacturing
2 The Statistical Quality Control
In 1931, Walter
A. Shewhart gave quality a scientific footing with the publication of his book
Economic Control of Quality of Manufactured Product. Shewhart was one of a
group of people at Bell Laboratories investigating problems of quality. Statistical
quality control requires that numbers derived from measures of processes
or products be analyzed according to a theory of variation that links outcomes
to uses.
Shewhart's Views of Quality
Shewhart
offered a pragmatic concept of quality: "The measure of quality is a
quantity which may take on different numerical values. In other words, the
measure of quality, no mater what the definition of quality may be, is a
variable". Shewhart's emphasis on measurement in his definition of
quality obviously relates to his prescriptions for statistical quality
control, which requires numbers.
Shewhart
recognized that industrial processes yield data. For example, a process in
which metal is cut
into sheets
yields certain measurements, such as each sheet's length, height and weight.
Shewhart
determined this
data could be analyzed using statistical techniques to see whether a process is
stable and in control, or if it is being affected by special causes that
should be fixed. In doing so, Shewhart laid the foundation for control
charts, a modern-day quality tool.
Shewhart's
concepts are referred to as statistical quality control (SQC). They differ from
product
orientation in
that they make quality relevant not only for the finished product but also for
the process
that created
it.
Executive Summary: Shewhart and his subjective view on quality, statistics
3 The Strategic Quality Management
The present
quality era, Strategic Quality Management, incorporates elements of each of the
preceding eras, particularly the contributions of Shewhart, Deming, Juran,
and Feigenbaum. So many elements of previous eras are incorporated into
Strategic Quality Management that the last two decades may at first appear
to be just a repackaging of old ideas. There are, however, dramatic differences
from earlier eras.
For the first
time, top managers began to view quality positively as a competitive advantage,
and to
address it in
their strategic planning processes, which are focused on customer value.
Because quality
started to attract the attention of top managers, it impacted management
throughout the organization. Quality was not just for the inspectors or
people in the quality assurance department to worry about. This era marks
the emergence of a new paradigm for management. A number of
developments
were brought together and reconfigured into a new approach to management in all
departments and
specialties.
A variety of
external forces brought quality to the attention of top managers. They began to
see a link
between losses
of profitability and poor quality. The forces that brought this connection to
their
attention
included a rising tide of multimillion-dollar product liability suits for
defective products and
constant
pressures from the government on several fronts, including closer policing of
defects, product recalls. Perhaps the most salient external force was the
growing market share incursions from foreign competitors, particularly the
Japanese, in such diverse industries as semiconductors,
automobiles, machine tools, radial tires, and consumer electronics.
Producing
products with superior quality, lower cost, and more reliable delivery,
Japanese firms gained market shares and achieved immense profitability.
The onslaught of these events in the mid-1970s and 1980s seemed rather
sudden, However, Japanese firm had been building their industrial capabilities
for decades, developing and refining approaches to quality grounded in the
principles taught to them by Americans after World War II. Manager and
theorists have been captivated by "Japanese management" over the
last two decades. Indeed, the Strategic Quality Management era borrows a number
of it elements from the developments that quality took place in Japan at
the same time as the quality assurance era in the United States.
Executive summary: The Quality Control Handbook by Juran.
4 Total Quality
Management
Just as the
definition of quality has been a source of confusion, so has the definition of
Total Quality
Management.
There is no consensus on what constitutes TQM. Almost every organization
defines it
differently or
calls it something other than TQM although it is often used to refer to
the management approaches being developed in the current era of Strategic
Quality Management while the new paradigm is emerging. Ideally, managers
in the Strategic Quality Management era regard total Quality management as
something more than a "program," and take it beyond all the
deficiencies mentioned earlier.
In this
context, the word "Total" conveys the idea that all employees,
throughout every function and
level of an
organization, pursue quality. The word "quality" suggests excellence
in every aspect of the
organization.
"Management" refers to the pursuit of quality results through a
quality management
process. This
begins with strategic management processes and extends through product design,
manufacturing,
marketing, finance, and so on. It encompasses, yet goes beyond, all of the
earlier
definitions of
quality by puling them together into a never-ending process of improvement.
Accordingly,
TQM is as much about the quality process as it is about quality results or
quality products.
Executive Summary: Strategic Planning, goal setting, staff training, IT introduction.
References:
https://de.wikipedia.org/wiki/Total-Quality-Management
http://www.ukessays.com/essays/management/the-4-eras-of-quality-management-management-essay.php
Subscribe to:
Posts (Atom)