A Gantt chart is a project management tool for project activities schedule which consists of a type of bar chart. Gantt charts illustrate the start and finish dates of the work breakdown structure (the terminal and summary elements) of a project, as well as the precedence network of the activities therein (dependency). Gantt charts can be used to show current schedule status using percent-complete shadings.
Among the advantages of a gantt chart is the possibility of visualising the duration of every activity through a relationship of start to finish to every activity in the course of the project.
Examples of Gantt chart:
 |
| http://www.vertex42.com/ExcelTemplates/excel-gantt-chart.html |
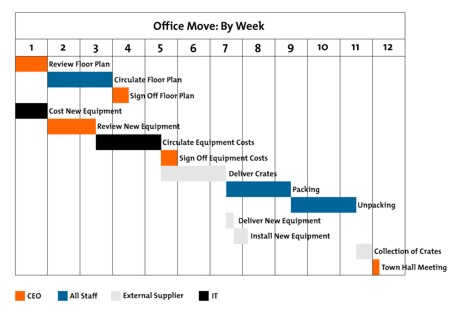 |
| https://www.mindtools.com/pages/article/newPPM_03.htm |
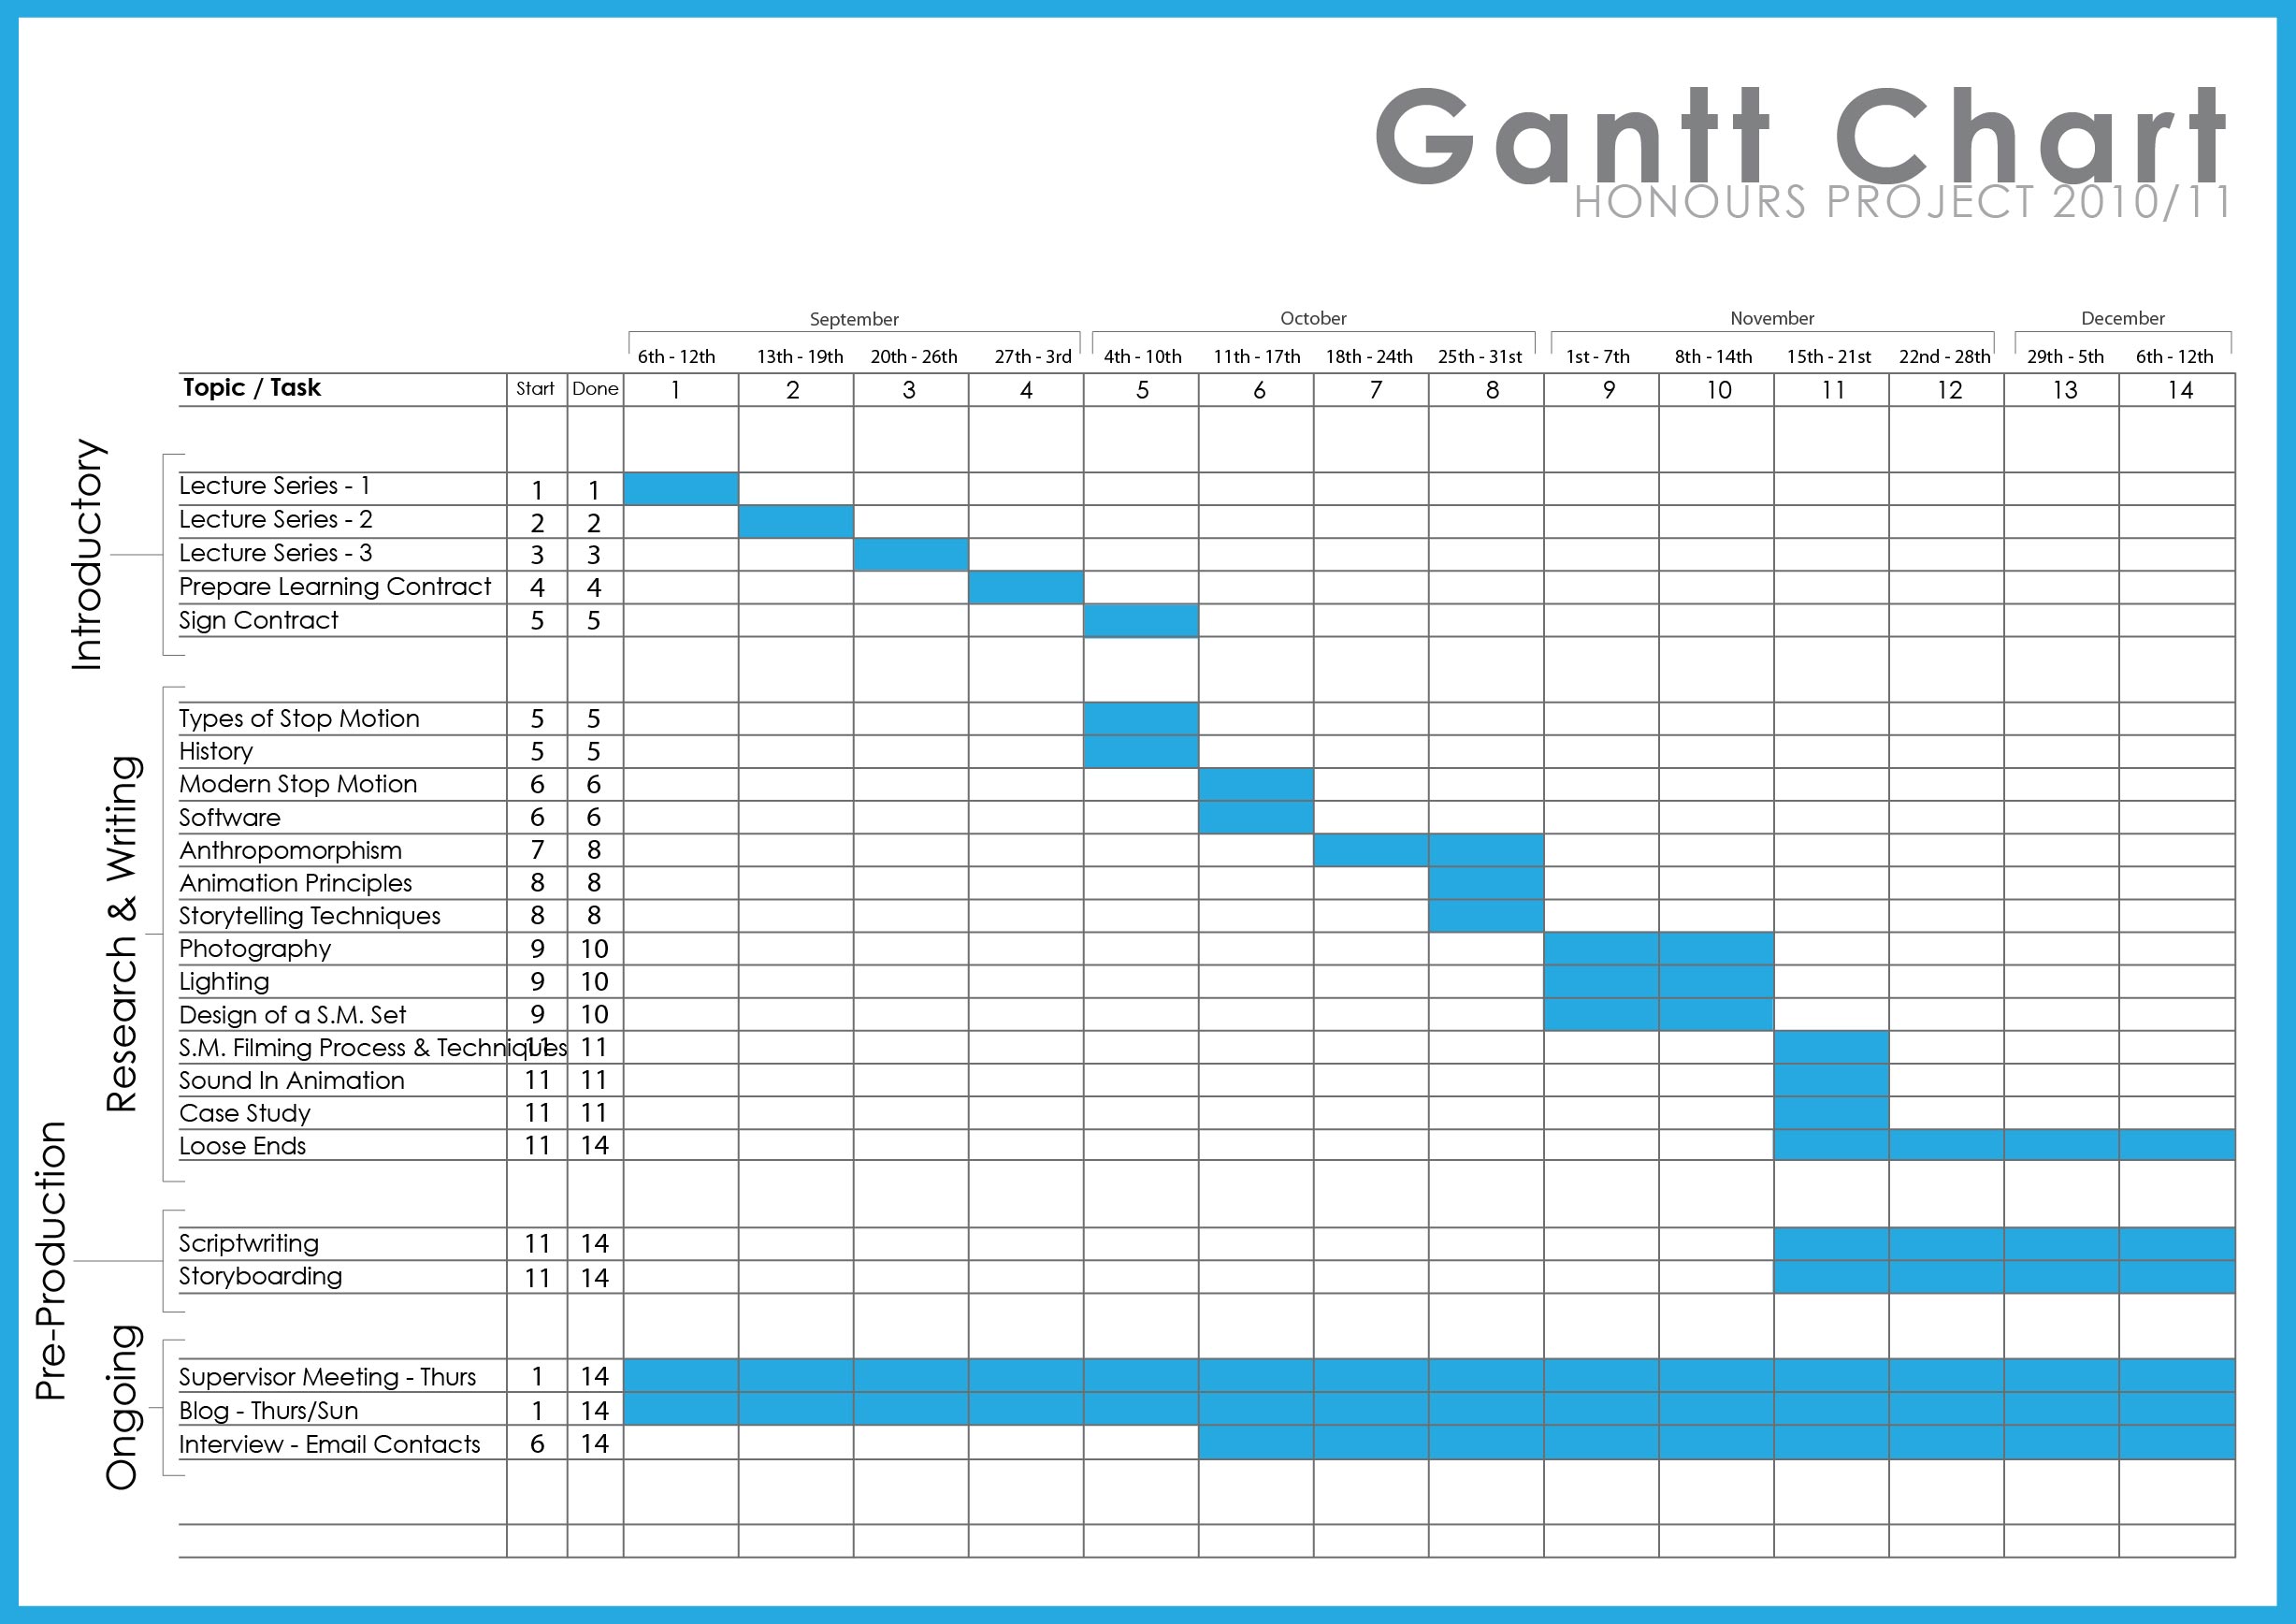 |
| https://mechanicalsympathy.wordpress.com/2010/10/25/gantt-chart-v1-1/ |
No comments:
Post a Comment